Disparities in PPP Lending by Gender

The Paycheck Protection Program (PPP) was Congress’s main effort to ameliorate the pandemic’s effects on small businesses. As of January 31, 2021, the Treasury Department doled out over 6 million loans totaling nearly 600 billion dollars with an average loan amount of $98,560. The initial rollout of the program has been criticized for favoring larger businesses seeking higher loan amounts and effectively shutting out smaller minority and women owned businesses most likely to shutter their doors without immediate financial relief. (https://www.bloomberg.com/graphics/2020-ppp-racial-disparity/; https://www.prnewswire.com/news-releases/new-study-finds-women-owned-businesses-were-passed-over-in-the-ppp-loan-process-301046329.html)
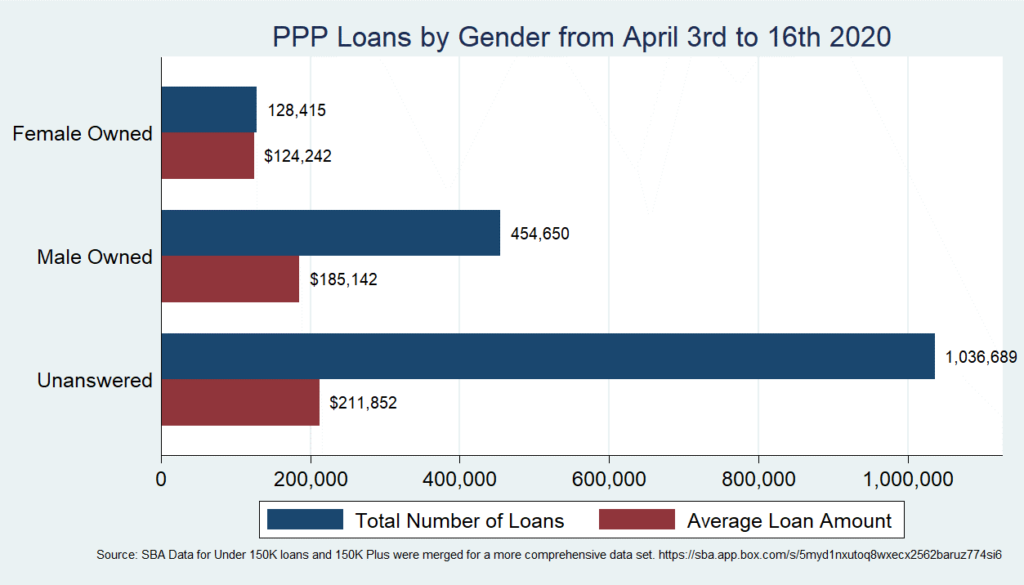
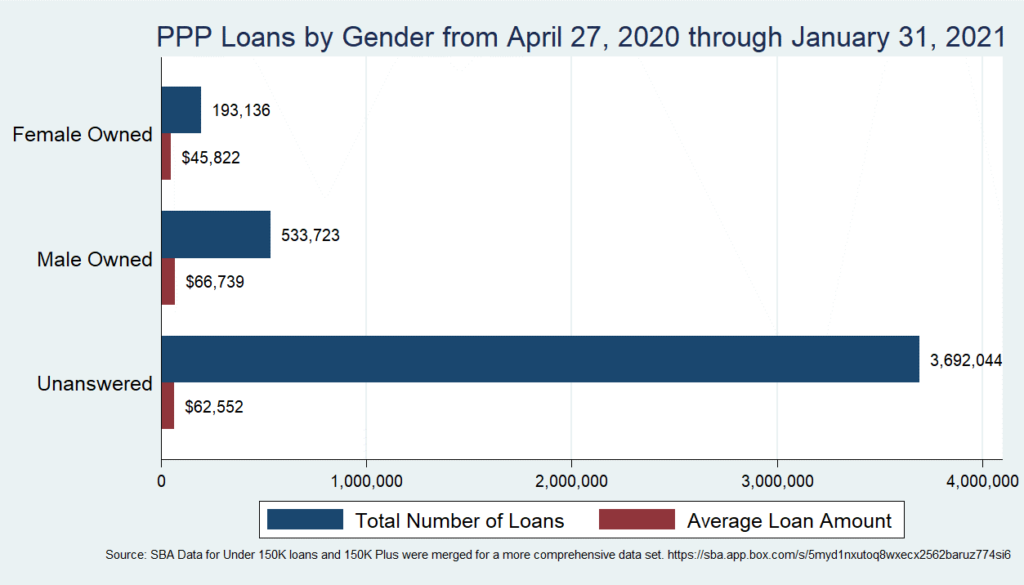
The data from the Treasury department shows that loan averages for the first window of PPP loans, between April 3rd and April 16th, before the money ran out were much higher than the loans paid out the months following. All of the PPP loan data shows that male owned businesses received a larger loan amounts than female owned businesses and at a higher rate compared to the number of male owned businesses in the nation. According to 2017 Census data, women owned businesses made up 39% of employer and non-employer firms in the United States (https://data.census.gov/cedsci/all?q=AB1700CSA01; https://www.census.gov/programs-surveys/abs/data/nesd.html). In the first window of the PPP program women owned businesses made up only 22% of the firms that responded to the gender demographic question for PPP loans. From April 27th 2020 to January 31st, 2021 women owned businesses made up 27% of the firms that responded to the gender demographic question for PPP loans. Therefore, women owned businesses received loans at a rate between 12-18% less than there overall make up as business owners in the nation.
There is also evidence for both periods PPP loans were made available the percentage of women owned businesses receiving loans and the average amount they received is even lower than the data indicates. For both time periods female owned businesses received lower average loan amounts than male owned businesses and loan applicants that did not respond to the gender question on the application.
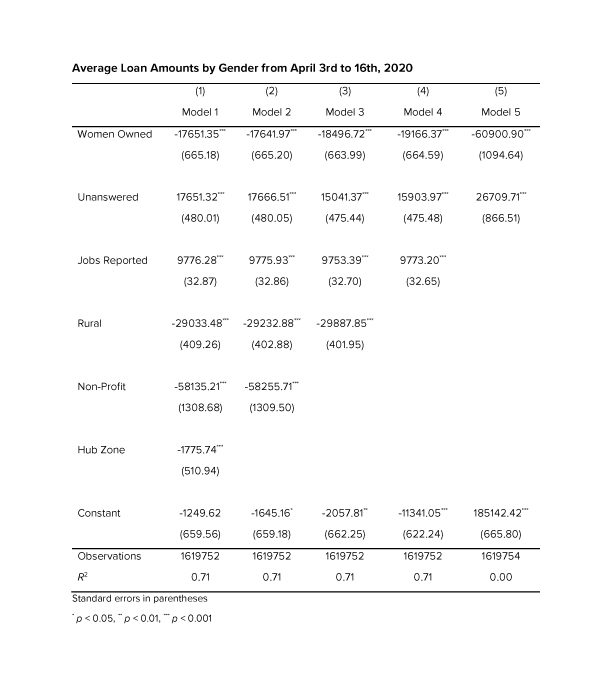
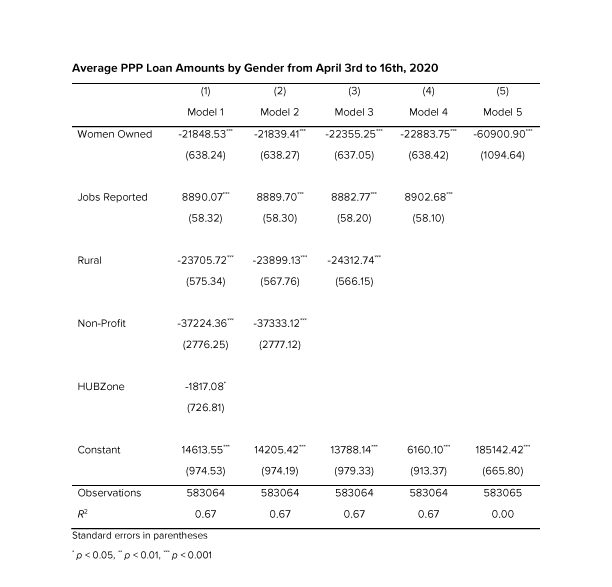
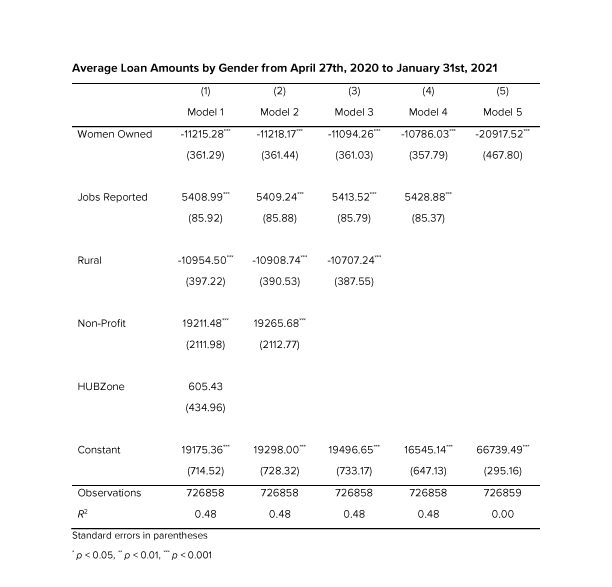
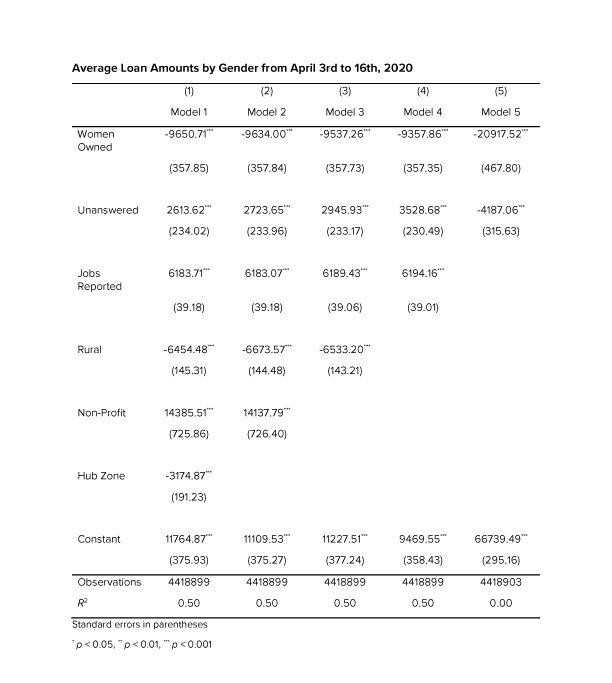
Simple regressions which omitted unanswered responses, and controlled for the number of employees a business, whether the loan was made to a rural or urban business, whether the firm was a nonprofit and whether the business was located in an area defined by the SBA as a Historically Underutilized Business Zone (HUBZone) showed that women owned businesses received significantly lower loan amounts than male owned businesses (P-Values less than .1%) for the time periods represented in the charts below. From April 3rd to April 27th 2020, women owned businesses received an average of $21,848 dollars less than male owned businesses. From April 27th 2020 to January 31st 2021, women owned businesses received an average of $11,215 dollars less than male owned businesses.
In the first period that PPP loans were available, businesses that did not respond to the gender demographic question in their loan application received higher average loan amounts than the respondents that did respond to the gender demographic question. Given that women owned businesses received significantly lower loan amounts than male owned businesses in both time periods the unanswered loan amount category should fall in the upper-middle range of the average loan amounts for male and female owned businesses if it comprises the same ratio of male to female owned businesses as the firms that responded to the demographic question on their loan applications. The higher loan averages for the unanswered category between April 3rd to the 16th suggests two things.
- Female business owners were likely even more underrepresented than the data suggests.
- The discrepancy of average loan amounts between male and female owners is even higher than the data suggests for the first time period PPP loans were given.