Disparities in PPP Lending by Race

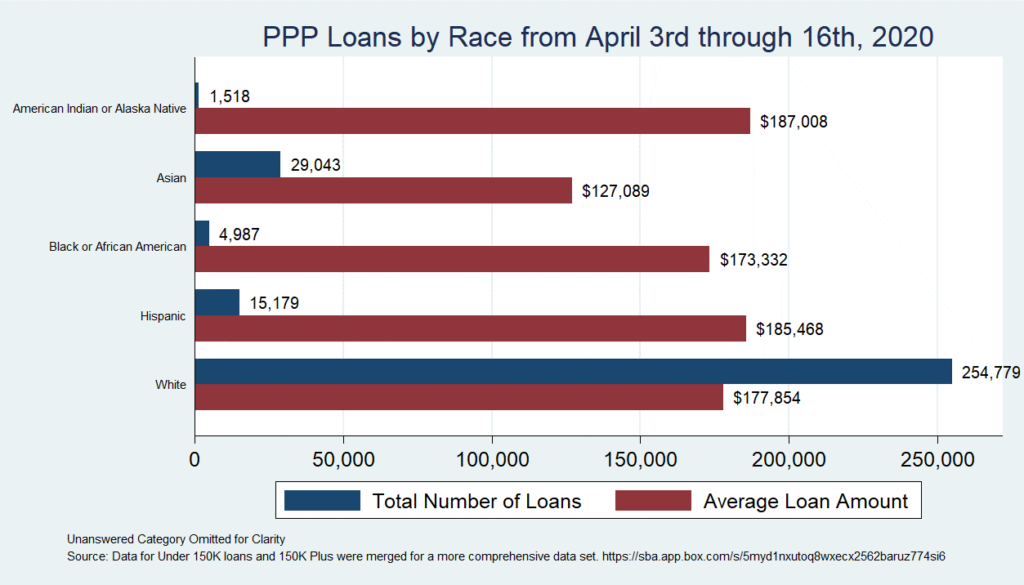
PPP loan data on race reveals disparities in the number of loans for the first time period PPP loans were given and amount of loans given to minority and non-minority owned businesses for both time periods. According to 2017 Census data minority owned businesses made up 31% of employer and non-employer firms, non-minority owned businesses made up 68% of total businesses in the U.S., and businesses equally minority and non-minority owned made up less than 1%. According to loan data in which respondents answered the demographic question on race, non-minority applicants received 83% of loans and minority businesses only received 17% of loans for the first period PPP loans were available. Black owned businesses fared the worst compared to their overall make-up of businesses owners in the first window of opportunity. Black owned businesses only received 1.6% of loans when they made up 10% of U.S. businesses owners according to U.S. Census data.