PPP (Paycheck Protection Program) Disparities by Gender in North Carolina by Year
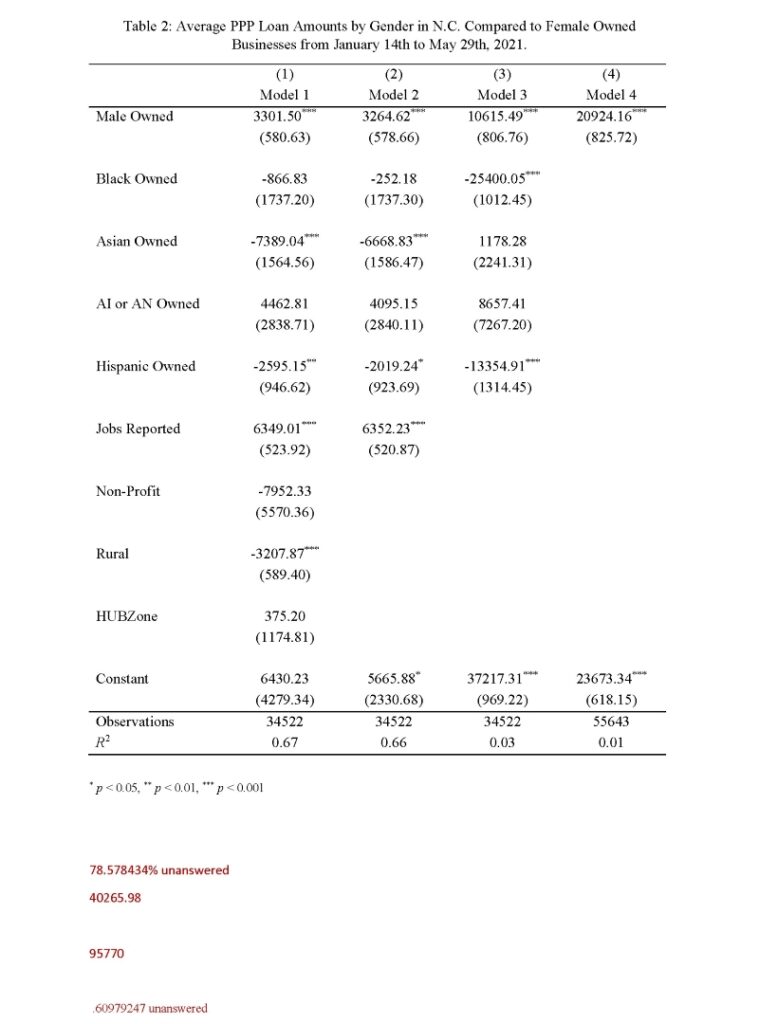
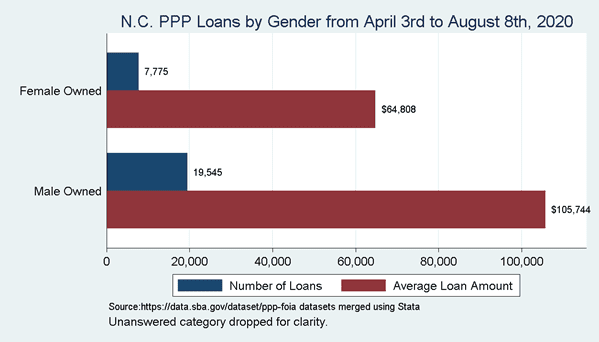
In order to determine whether Paycheck Protection loans in the North Carolina, suffered the same disparities between gender and race, as we found in our previous articles for 2020 PPP data. PPP loans were aggregated to include only North Carolina and included loan over and under 150K. In months that PPP were available in 2020, the disparities were much greater for loans given to male-owned businesses and women-owned businesses and were equivalent to amount of loans given between male and female owned business, however male owned businesses were awarded significantly higher loan amounts than female owned businesses. The demographic count almost doubled for gender between the two years, with the loans given in 2020 had close to 39% of loan applicants responding to the gender question, while 2021 had around to 78% responded as female owned businesses rate. Surprisingly, there were very few disparities between the loans given out in 2020 between male and female owned businesses and female businesses were overrepresented in the 2021 when compared to the overall business demographics of the North Carolina.
According to the most recent Census data that includes both Employer and Employer data statistics. The 2017 Census showed that female owned businesses made up 38.94% and male owned businesses made up 54.70% of Employer and Non-Employer businesses (percents do not add up to 100% because the Census includes equally/male and female owned as a separate category).
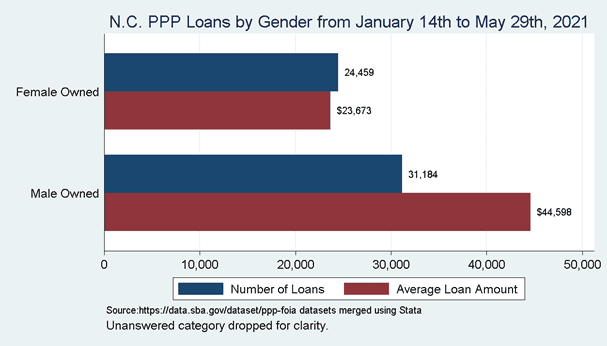
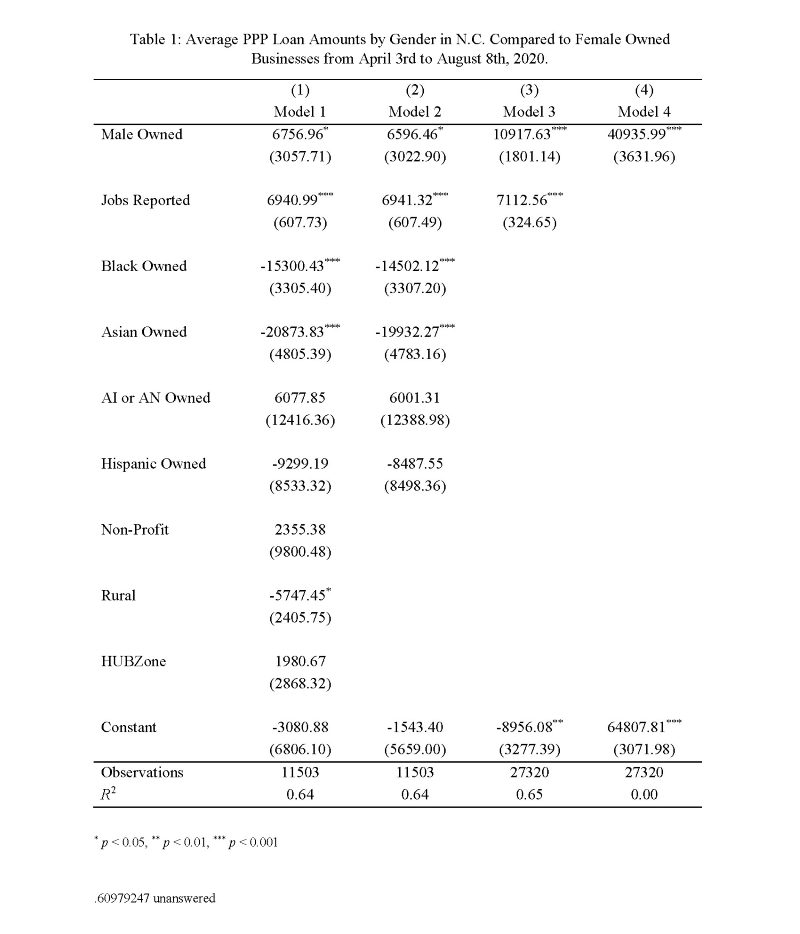
Male-owned businesses still received significantly more loans than female owned businesses. According to Model 1 in Table 1 below, male-owned businesses received and average of $6,759.96 more than female owned businesses, which is statistically significant at the five percent level. The model accounts for numerous factors that would affect loan amounts. The first and most important is jobs, the more jobs a business employee the more they will need to protect their employees’ paychecks and borrow more money. As the model shows for each employee a business reports they receive on average of $6,940.99, which is significant at less than the one percent level. Controls for race where also added which have been shown in many studies have shown that race has been shown to affect loan amount. Non-Profits, businesses in rural areas, and areas specifically designated as Historically Underutilized Zone (HUBZone). These controls were added to show that even when we disregarded the number of jobs a business employs, the race of the business owner, whether they are in an urban or rural area, or whether they are in a designated HUBZone female owned businesses still receive significantly less loan amounts than male-owned businesses.
Moreover, while the charts and the tables may show significant improvement in the amount of loans given when we did deeper the picture tells a different story. According to Model 1, in 2020 data male-owned businesses are given and average of $6756.96 more than female-owned businesses, while in the 2021 data male-owned businesses are given an average of $3301.50 more than female-owned businesses. So, male-owned businesses received around 2.05 times more than female-owned businesses when adjusting for controls. However, when looking at the mean amounts of total loans given, we see that in 2020 the average loan was $95,770 and in 2021 the average loan given was $40,266. Therefore, the average loans that were given in 2021 were 42% less than the average loan given in 2021. This means that the disparities between PPP loans given to male owned businesses and female owned businesses were about the same between the two years and may have been worse in 2021.
+
